ARPIExecutive

Executive

All three stores · October 2025 · vs September 2025

Granite Auto Group is fictional. Operating figures are synthetic.

Every warehouse record in this project is synthetic. Granite Auto Group and its three stores are fictional. No real dealership, customer, employee or lending data exists anywhere in the project.

The SQL export lane

Every figure on this page is read from a versioned export taken from the reporting schema by a read-only role at build time. The browser holds no database connection, no credential and no query.

Dataset version
v17
Contract version
v1
Data as of
31 December 2025
Contract digest
4b77a5bf9322
Profile
development
Random seed
20250701
  • Export reconciliationPassed: 134 of 134 passedEvery published total is an exact sum over an additive exported column, re-derived from the committed rows. A ratio publishes its numerator and denominator separately and no quotient.
  • Privacy scanPassed: passedThe exporter scans every column of every approved view against the prohibited-field list before writing a byte. No customer-grain dataset exists.
  • Pipeline validationPassed: 0 critical, 0 warningsThe warehouse run this export was taken from. A failing run cannot produce a passing export: the exporter refuses to run.
  • Source pipeline runPassed: succeededRun 40f491ba-a58e-43f4-acea-18cb63d2a6ef, profile development, seed 20250701.
  • Contract freshnessPassed: CurrentThe contract digest recorded in the export matches the declared contract. Freshness is a contract comparison, not a wall-clock age.
  • Synthetic dataPassed: DeclaredEvery warehouse record is machine generated from a seed. Granite Auto Group and its three stores are fictional.
Which reporting views produced these figures

The exporter reads an explicit allowlist and nothing else. It never touches the raw, staging, warehouse or audit schemas, and a column outside the declared contract fails the export rather than being dropped.

  • reporting.vw_accounting_exceptions
  • reporting.vw_appointment_funnel
  • reporting.vw_appointment_source_funnel
  • reporting.vw_calendar
  • reporting.vw_days_supply
  • reporting.vw_days_to_sale
  • reporting.vw_deal_explorer
  • reporting.vw_deal_jacket
  • reporting.vw_deal_product_detail
  • reporting.vw_dealership
  • reporting.vw_employee
  • reporting.vw_employee_lead_source_response
  • reporting.vw_employee_performance
  • reporting.vw_fi_adjustment_summary
  • reporting.vw_fi_product_penetration
  • reporting.vw_fi_summary
  • reporting.vw_gross_change_bridge
  • reporting.vw_gross_summary
  • reporting.vw_inventory_accounting
  • reporting.vw_inventory_aging
  • reporting.vw_inventory_gl_reconciliation
  • reporting.vw_inventory_health
  • reporting.vw_inventory_turn
  • reporting.vw_inventory_units
  • reporting.vw_lead_funnel
  • reporting.vw_lead_response
  • reporting.vw_lead_response_distribution
  • reporting.vw_lead_source
  • reporting.vw_lead_stage_loss
  • reporting.vw_marketing_campaign
  • reporting.vw_marketing_performance
  • reporting.vw_pipeline_run_summary
  • reporting.vw_reconciliation_status
  • reporting.vw_sales_gross_trend
  • reporting.vw_sales_summary
  • reporting.vw_target_attainment
The known limits of this data
  • SYNTHETIC DATA -- 100% machine generated. Granite Auto Group and every store, employee role and transaction referenced by this project are fictional. No real customer, employee, dealership or vendor data is present, and no record here describes a real person or a real business.

  • Granite Auto Group is a fictional dealer group. Every store, employee role and transaction in this export is machine generated.

  • The export carries the governed KPIs implemented to date. Lead-source quality, campaign cost and employee performance are modelled; no dataset here stands in for anything that is not.

  • management-actions is a DERIVED artifact. It reads no view: it is produced by evaluating config/dashboard/action_rules.yaml against the datasets in this same export, so every action can be recomputed by hand from files in the repository. Its rows are review prompts, not findings, recommendations of business action, or evidence of real-world conditions, and the queue is stateless -- regenerated with each dataset version, holding no history, acknowledgement, assignment or completion. No language model, learned model or scoring heuristic takes any part in producing it, and every threshold the rule file owns is a project default for a fictional dealer group.

  • The action register retains every proposed rule identifier, including those that do not fire. A disabled identifier carries the audited reason it is disabled: the project holds no such evidence, the evidence exists at a different grain, or the condition cannot survive into a valid export and belongs to the validation layer rather than to a management queue.

  • The GL control accounts are SYNTHETIC and there are three of them. They are a selected inventory control catalogue, not a chart of accounts, and no real dealer group's account numbering was consulted. ARPI models no journal entry, journal line, posting batch, trial balance, period close or financial statement, so nothing in this export is or supports a financial-statement assertion.

  • Both sides of the inventory reconciliation are generated from one governed model. It is not agreement between two independent systems, and the development dataset contains deliberately planted controlled variance scenarios so that all four comparison states are exercised. A nonzero variance is a position to investigate and is not evidence of an accounting error.

  • Inventory control balances are semi-additive. They add across stores and control accounts on ONE comparison date and never across dates; a period figure is the last comparable date within it. A missing side is published as null, never as zero, because a balance that does not exist is not a balance of zero.

  • market_price_estimate is a SYNTHETIC estimate generated for this fictional dataset. No auction result, guidebook, licensed benchmark or observed transaction is consulted anywhere in this project. price_to_market_ratio describes the asking price against it and is null where no estimate exists; neither is evidence that a price is right or wrong, and neither supports a repricing recommendation.

  • Price movement is derived from consecutive month-end snapshots of the same unit. ARPI holds no price-history fact and models no manager decision, pricing strategy or repricing action, so an observed decrease is an observation and nothing more.

  • Floorplan principal is liability context carried alongside a unit. It is not part of book value, is never netted against it, and ARPI publishes no net inventory position and models no floorplan interest, curtailment or carrying cost.

  • Manufacturer incentives, holdback and floorplan credits are excluded from front gross, so new-vehicle front gross is understated by construction. That is a modelling boundary, not a finding.

  • Ratios and rates are exported unrounded at the scale the reporting view produced. display_precision states how the console should render them; the export never discards the exact value.

  • Median, percentile, days-supply and inventory-turn figures are not additive. No group-level total is published for them, because a group median is not the average of store medians. Their evidence is row-level equality with the source view.

  • logical_run_key is null: ADR-0010's logical run key is recorded in the audit layer's pipeline-run table, the reporting layer does not publish it, and the exporter may not read that schema. It is left null rather than guessed.

  • Power BI real-engine validation remains pending on both ADR-0008 paths. Nothing in this export validates the semantic model, and no artifact here may be cited as Gate 2 evidence.

  • aged_threshold_days and the age-bucket boundaries are labelled project defaults, never industry benchmarks.
Generated 2026-08-10T22:08:50+00:00 from source commit 3faccac06b95, pipeline run 40f491ba-a58e-43f4-acea-18cb63d2a6ef. The generation timestamp is provenance, not freshness: freshness is the contract comparison above.

The Power BI lane

Real-engine validation pending

Real-engine validation pending. Neither accepted ADR-0008 path has recorded a result, so nothing on this page may be read as evidence that the Power BI semantic model has been validated. This console renders exported SQL figures; rendering a number in HTML proves nothing about a DAX measure.

Gate 2 remains CLOSED. This console publishes figures and deterministic rule outputs, never findings, recommendations or conclusions, and it may not be cited as Gate 2 evidence.

Power BI remains the canonical analytical product for this project. This console renders exported SQL figures; it does not run DAX, does not validate the semantic model, and may not be cited as evidence toward Gate 2 or ADR-0008. The status page holds the full validation ledger.

Selected period
October 2025
Comparison
Prior period: September 2025
Store scope
All three stores
Data as of
31 December 2025
Dataset
Version 17 · contract 4b77a5bf9322
Provenance
Deterministic synthetic data. Granite Auto Group is fictional.
What the URL accepts

Filter state lives entirely in the query string. There is no cookie, no stored preference and no server session: a copied link reproduces the view, the back button is the undo stack, and the parameter names are the ones in the information architecture rather than a shorthand invented for this page. Unknown parameters are ignored; an invalid value falls back to its default and the page says so.

  • /?period=2025-11

    A single calendar month.

  • /?period=2025-11-15..2025-12-15

    An arbitrary date range, inclusive at both ends.

  • /?store=GSA-001,GSA-002

    Two stores at once. Absent means the whole group.

  • /?compare=prior-year

    Comparison against the same window a year earlier. Withheld when that window is outside the exported reporting period.

  • /?period=2025-12-01..2025-12-01&store=GSA-001&source=LDS-001

    The scope at which an order statistic resolves: one store, one lead source, one day.

The full parameter set also accepts scope, dept, employee, campaign, make, model, structure and product. They are part of the console-wide grammar so that every page spells a filter the same way; this page holds no dataset carrying those attributes and says so above rather than pretending to apply them.

How this is built, governed and validated

Filters and controls1 applied

Inventory measures only.

Funnel measures only.

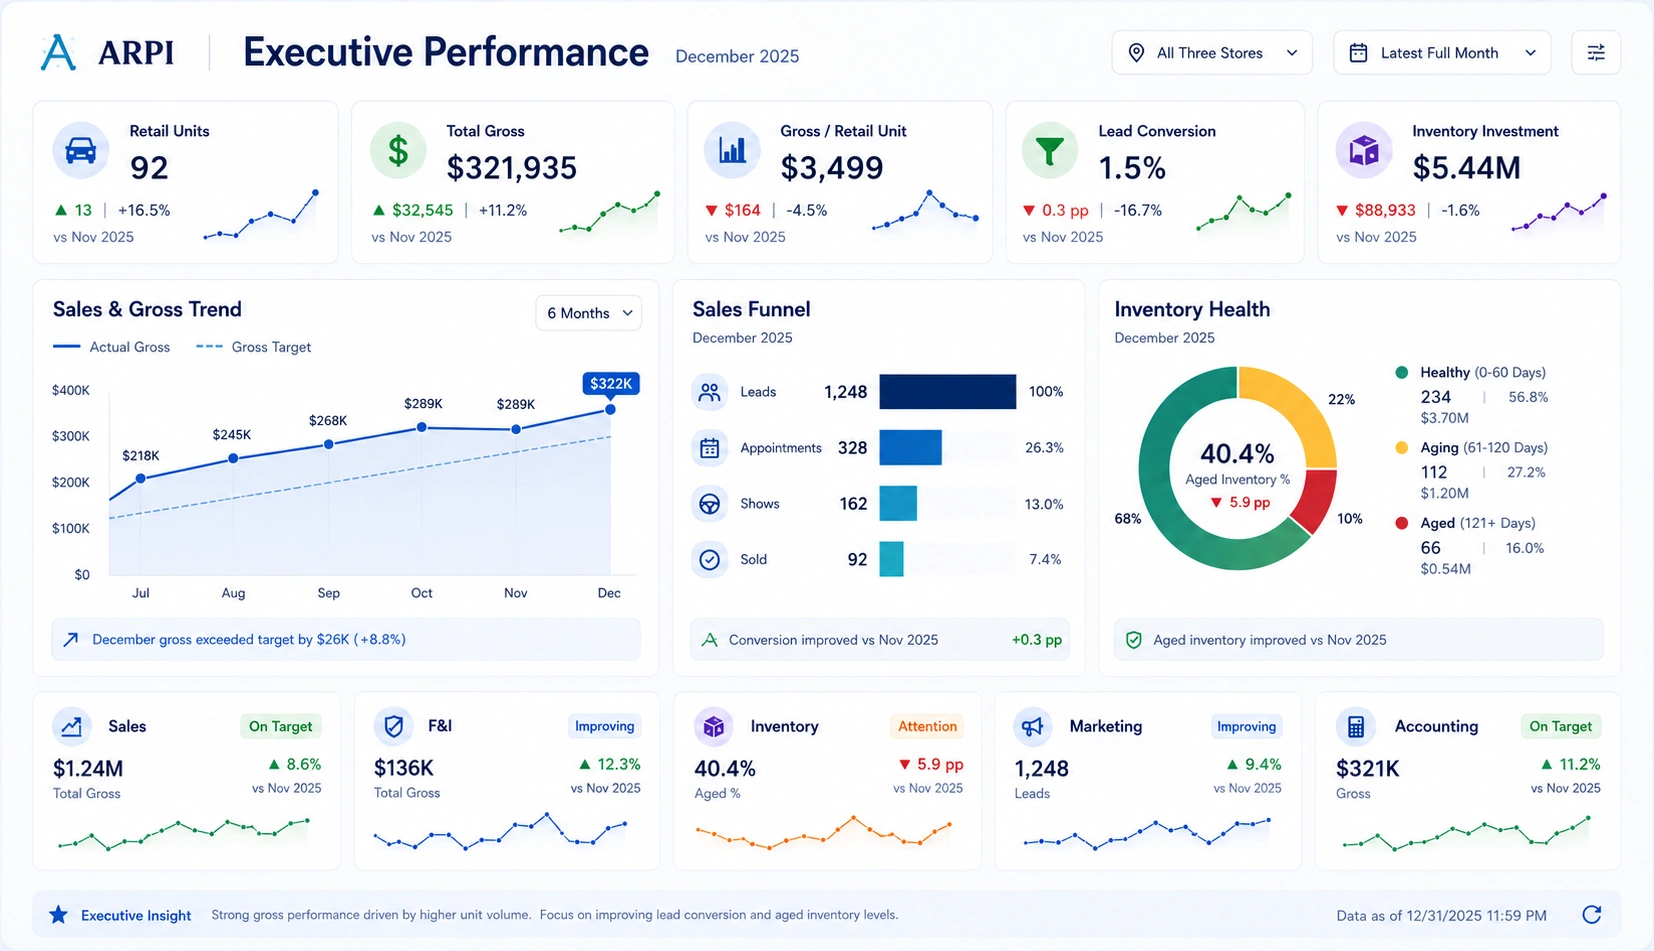
ARPI executive dashboard interface preview showing dealership KPIs, performance trends, sales funnel, and inventory health

Executive interface preview. Live governed dashboard below.

Group result

October 2025

Colour marks sign, a met target and unit age. Nothing else.

  • Retail units

    80

    -8 units lower than September 2025

    Trailing 4 months to October 2025, ending at 80.

    • July 2025: 103
    • August 2025: 116
    • September 2025: 88
    • October 2025: 80

    KPI-SLS-001units

  • Total gross

    $256,409

    -$100,529 lower than September 2025

    Trailing 4 months to October 2025, ending at $256,409.

    • July 2025: $358,088
    • August 2025: $353,812
    • September 2025: $356,938
    • October 2025: $256,409

    KPI-GRS-003

  • Total gross per retail unit

    $3,205

    -$851 per retail unit lower than September 2025

    Trailing 4 months to October 2025, ending at $3,205.

    • July 2025: $3,477
    • August 2025: $3,050
    • September 2025: $4,056
    • October 2025: $3,205

    KPI-GRS-006

  • Front gross per retail unit

    $1,897

    -$926 per retail unit lower than September 2025

    KPI-GRS-004

  • Back gross per retail unit

    $1,309

    +$75 per retail unit higher than September 2025

    KPI-GRS-005

  • Lead-to-sale conversion

    4.5%

    -1.5 percentage points lower than September 2025

    KPI-FUN-006

  • Inventory investment

    $5,503,203

    -$147,444 lower than September 2025

    KPI-INV-002

  • Aged inventory percentage

    40.6%

    +9.1 percentage points higher than September 2025

    KPI-INV-006

Lead-creation cohort: a lead created in the period counts here even if it sells later. · Position at 2025-10-31

How every figure on this rail is measured

Retail units

Governed KPI
KPI-SLS-001 Retail units sold
Plain English
The primary volume measure of the business, and the denominator of every per-unit gross measure. It answers how many cars the group delivered.
Inclusions and exclusions
The count of finalized retail and lease deliveries in the period. Wholesale disposals and dealer trades are not retail units and are never counted here.
Formula
SUM(unit_count) WHERE is_retail = true
Numerator
SUM(warehouse.fact_vehicle_sale.unit_count) over rows where is_retail = true, restricted to the selected period and filter context.
Denominator
n/a - additive measure
Grain
Store x day; fully additive across store, day, employee, vehicle, model, and lead source; aggregates to any period without restatement.
Date basis
warehouse.fact_vehicle_sale.sale_date_key to warehouse.dim_date. Sale date, not delivery date; delivery-date reporting via delivery_date_key must be labelled as such.
Unit
Integer count. Thousands separator. No decimals.
Null behaviour
No denominator. An empty filter context returns 0, never BLANK(), because no cars sold is a meaningful business answer that must be visible on a trend line.
Source reporting view
reporting.vw_sales_summary
Known limitations
Volume alone must never be used to rank employees or stores; a high-volume employee may show weak gross retention, poor follow-up, or heavy discounting. Always pair with KPI-GRS-006 and funnel context.
What this page selected
Sum of the exported additive column `retail_units_sold` over the period.

Total gross

Governed KPI
KPI-GRS-003 Total gross
Plain English
The headline profitability figure and the single most-quoted number in dealership management reporting.
Inclusions and exclusions
Front-end gross plus back-end gross on finalized retail deliveries.
Formula
front-end gross + back-end gross
Numerator
SUM(warehouse.fact_vehicle_sale.total_gross) over rows where is_retail = true, where total_gross = front_end_gross + back_end_gross, stored at load rather than recomputed at query time.
Denominator
n/a - additive measure
Grain
Store x day; fully additive.
Date basis
sale_date_key to dim_date.
Unit
Currency, USD, no decimals at summary level.
Null behaviour
No denominator. Returns 0 in an empty context. May be negative; must remain visible.
Source reporting view
reporting.vw_gross_summary
Known limitations
Total gross conceals the trade-off between front and back; a flat total gross trend can hide a collapsing front offset by rising F&I, a materially different business. Always show KPI-GRS-001 and KPI-GRS-002 alongside it.
What this page selected
Sum of the exported additive column `total_gross` over the period.

Total gross per retail unit

Governed KPI
KPI-GRS-006 Total gross per retail unit
Plain English
The single most useful summary of deal quality, and the correct companion to unit volume in any employee or store comparison.
Inclusions and exclusions
Average total profit, vehicle plus finance office, earned on each retail unit delivered in the period.
Formula
total retail gross / retail units sold
Numerator
SUM(warehouse.fact_vehicle_sale.total_gross) over rows where is_retail = true.
Denominator
SUM(warehouse.fact_vehicle_sale.unit_count) over rows where is_retail = true, same filter context; must exclude wholesale and dealer-trade transactions.
Grain
Store x period. Non-additive ratio.
Date basis
sale_date_key to dim_date.
Unit
Currency per unit, USD, no decimals.
Null behaviour
Zero denominator returns BLANK()/NULL.
Source reporting view
reporting.vw_gross_summary
Known limitations
The correct counterweight to volume in employee analysis, but not sufficient alone; scorecards must carry contextual metrics such as lead volume, source mix, tenure, and inventory availability, since ranking on gross per unit alone penalizes whoever gets the harder inventory.
What this page selected
Exported `total_gross` summed over the period, divided by exported `retail_units_sold` summed over the same rows.

Front gross per retail unit

Governed KPI
KPI-GRS-004 Front gross per retail unit
Plain English
Normalizes vehicle profit for volume so stores of different sizes can be compared, and so a profit change can be attributed to pricing rather than volume.
Inclusions and exclusions
Average vehicle profit earned on each retail unit delivered in the period.
Formula
total retail front-end gross / retail units sold
Numerator
SUM(warehouse.fact_vehicle_sale.front_end_gross) over rows where is_retail = true, in the filter context.
Denominator
SUM(warehouse.fact_vehicle_sale.unit_count) over rows where is_retail = true, same filter context; must exclude wholesale and dealer-trade transactions.
Grain
Store x period. Non-additive; must be recomputed at every level of aggregation, never summed or averaged from lower levels.
Date basis
sale_date_key to dim_date. Numerator and denominator must use the identical date basis and filter context.
Unit
Currency per unit, USD, no decimals, e.g. $1,842.
Null behaviour
When the denominator is 0, returns BLANK()/NULL, never 0; zero units sold means the metric is undefined. Charts must show a gap, not a zero point.
Source reporting view
reporting.vw_gross_summary, reporting.vw_vehicle_sales
Known limitations
A rising per-unit gross with falling volume is not automatically good; it may mean the store stopped chasing marginal deals. Pair with KPI-SLS-001. Never compare to an external benchmark.
What this page selected
Exported `front_end_gross` summed over the period, divided by exported `retail_units_sold` summed over the same rows: the catalogue numerator and denominator, divided once at the end.

Back gross per retail unit

Governed KPI
KPI-GRS-005 Back gross per retail unit
Plain English
The standard measure of finance-office productivity; answers how much is earned in F&I on every car delivered.
Inclusions and exclusions
Average finance and insurance profit earned on each retail unit delivered in the period.
Formula
total retail back-end gross / retail units sold
Numerator
SUM(warehouse.fact_vehicle_sale.back_end_gross) over rows where is_retail = true.
Denominator
SUM(warehouse.fact_vehicle_sale.unit_count) over rows where is_retail = true, same filter context; wholesale and dealer trades excluded.
Grain
Store x period. Non-additive ratio.
Date basis
sale_date_key to dim_date.
Unit
Currency per unit, USD, no decimals.
Null behaviour
Zero denominator returns BLANK()/NULL. A cash deal with no F&I products contributes 0 to the numerator and 1 to the denominator; it is included so cash deals do not overstate finance-office productivity.
Source reporting view
reporting.vw_gross_summary
Known limitations
The denominator includes cash deals, which cannot generate finance reserve; a store with an unusual cash mix will show a lower figure for reasons unrelated to finance-office skill. Cross-store comparisons must control for deal-type mix.
What this page selected
Exported `back_end_gross` summed over the period, divided by exported `retail_units_sold` summed over the same rows.

Lead-to-sale conversion

Governed KPI
KPI-FUN-006 Lead-to-sale conversion
Plain English
The end-to-end funnel result; the measure that determines whether a lead source is worth paying for.
Inclusions and exclusions
The share of valid leads that ultimately resulted in a finalized retail sale.
Formula
unique leads linked to a finalized retail sale / valid nonduplicate leads
Numerator
COUNT(DISTINCT warehouse.fact_lead.lead_key) where is_sold = true, is_duplicate = false, and sale_key resolves to a finalized retail sale. Exposed as reporting.vw_leads.sold_lead_count.
Denominator
COUNT(DISTINCT warehouse.fact_lead.lead_key) where is_duplicate = false, i.e. KPI-FUN-001, same filter context.
Grain
Store x period. Non-additive ratio.
Date basis
lead_created_date_key to dim_date on both sides; a lead created in March that sells in May counts in March, the lead's cohort rather than the sale's period.
Unit
Percentage, one decimal place.
Null behaviour
Zero valid leads returns BLANK()/NULL.
Source reporting view
reporting.vw_lead_funnel
Known limitations
Cohort maturity dominates: recent months always look worst since those leads have not finished converting. Attribution is single-source, first-touch; multi-touch attribution is out of scope.
What this page selected
Exported `sold_leads` divided by exported `leads_received`, both summed over the lead-creation cohort first.

Inventory investment

Governed KPI
KPI-INV-002 Inventory investment
Plain English
How much capital is tied up in stock; converts an aging problem from a count into a dollar figure, making it a management priority.
Inclusions and exclusions
The total money invested in the vehicles in stock on a given date: acquisition cost plus reconditioning spend.
Formula
SUM(acquisition_cost + reconditioning_cost)
Numerator
SUM(warehouse.fact_vehicle_inventory_snapshot.inventory_investment) for rows on the selected as-of date, where inventory_investment = acquisition_cost + reconditioning_cost.
Denominator
n/a - additive measure
Grain
Store x snapshot date. Semi-additive, same rule as KPI-INV-001.
Date basis
snapshot_date_key to dim_date, single as-of date.
Unit
Currency, USD, no decimals; large values may be abbreviated, tooltip shows full figure.
Null behaviour
No denominator. Returns 0 when no units are in stock; BLANK() when the date has no snapshot rows.
Source reporting view
reporting.vw_inventory_health, reporting.vw_inventory_snapshots
Known limitations
This is cost invested, not market value or floor-plan exposure. ARPI models no floor-plan interest, holding cost, or carrying cost, so statements about what aged inventory costs per day are not supportable from this data.
What this page selected
Sum of exported `inventory_investment` at the single latest snapshot date in the period.

Aged inventory percentage

Governed KPI
KPI-INV-006 Aged inventory percentage
Plain English
Normalizes aged-unit exposure for lot size so stores with different inventory volumes can be compared on one scale; the standard inventory-health indicator on an executive page.
Inclusions and exclusions
The share of the active lot that has been in stock longer than the selected age threshold.
Formula
active inventory units above selected age threshold / total active inventory units
Numerator
SUM(warehouse.fact_vehicle_inventory_snapshot.inventory_unit_count) on the selected snapshot date where days_in_stock > @age_threshold, i.e. KPI-INV-005.
Denominator
SUM(warehouse.fact_vehicle_inventory_snapshot.inventory_unit_count) on the same snapshot date and filter context, with no age filter, i.e. KPI-INV-001.
Grain
Store x snapshot date. Non-additive ratio; recompute at every level.
Date basis
snapshot_date_key to dim_date, single as-of date, identical on both sides.
Unit
Percentage, one decimal place, e.g. 18.4%.
Null behaviour
Zero denominator returns BLANK()/NULL. Numerator 0 with a non-zero denominator correctly returns 0.0%.
Source reporting view
reporting.vw_inventory_health
Known limitations
Can improve for a bad reason: wholesaling aged units removes them from the numerator, so the percentage falls while the group takes a loss. Read alongside KPI-INV-002 and wholesale volume; ARPI has no benchmark for a healthy aged percentage.
What this page selected
Exported `aged_inventory_units` divided by exported `active_inventory_units` at the same snapshot date: KPI-INV-005 over KPI-INV-001 as the catalogue declares them, both additive at a single date.

Operating trend

Trailing months, anchored on the selection
Trend measure

Stores

Store comparison

Each measure is scaled to its own largest store. Lengths compare within a measure and never across two.

Retail units: Granite Chevrolet 34, Granite Subaru 30, Granite Pre-Owned 16. Total gross: Granite Chevrolet $113,471, Granite Subaru $69,354, Granite Pre-Owned $73,584. Total gross per retail unit: Granite Chevrolet $3,337, Granite Subaru $2,312, Granite Pre-Owned $4,599.

  • Granite Chevrolet
  • Granite Subaru
  • Granite Pre-Owned

Retail unitsKPI-SLS-001

  • 34
  • 30
  • 16

Total grossKPI-GRS-003

  • $113,471
  • $69,354
  • $73,584

Total gross per retail unitKPI-GRS-006

  • $3,337
  • $2,312
  • $4,599
Read store comparison as a table
Store comparison. Retail units: Granite Chevrolet 34, Granite Subaru 30, Granite Pre-Owned 16. Total gross: Granite Chevrolet $113,471, Granite Subaru $69,354, Granite Pre-Owned $73,584. Total gross per retail unit: Granite Chevrolet $3,337, Granite Subaru $2,312, Granite Pre-Owned $4,599.
StoreOperating modelRetail unitsTotal grossTotal gross per retail unit
Granite ChevroletFranchise New and Used34$113,471$3,337
Granite SubaruFranchise New and Used30$69,354$2,312
Granite Pre-OwnedIndependent Used16$73,584$4,599

Business-code order. Nothing is ranked and no store score exists: the three run different operating models.

Plan and pace

The projection is selling-day arithmetic, not a forecast. Targets are synthetic operating goals, not benchmarks.

Selling day 31 of 31Month complete, so attainment is final and the selling-day pace projection equals the actual.KPI-TGT-005 · KPI-TGT-006

Retail units against plan

Retail units83.3% of target

Retail units: 80 actual against a target of 96, 83.3% of target.

80Target 96

Pace2.58 units per selling dayKPI-TGT-007

Selling-day pace projection80KPI-TGT-009

Selling-day pace projection is 16 below target.

How retail units against plan is measured
  • Target (KPI-TGT-001): the sum of store-scope plan rows for the selected stores and months. Department rows exist in the same governed dataset and are refinements of the store plan, never addends.
  • Attainment (KPI-TGT-002): summed actual divided by summed target, over the same stores on both sides. It is never the average of store percentages, and a store with no plan contributes to neither side.
  • Pace (KPI-TGT-007): actual divided by governed selling days elapsed, counted from the governed date dimension’s selling-day flag and shared by all three stores.
  • Selling-day pace projection (KPI-TGT-009): pace multiplied by the month’s selling days. It is linear arithmetic over the calendar — not a forecast, not a prediction and not a statistical model — and it ignores the within-month shape of trading, so an early-month figure moves more than a late-month one.
KPI_CATALOG.mdsection 39 — KPI-TGT-001, KPI-TGT-002, KPI-TGT-007, KPI-TGT-009View KPI_CATALOG.md (section 39 — KPI-TGT-001, KPI-TGT-002, KPI-TGT-007, KPI-TGT-009) on GitHub (opens in a new tab)

Total gross against plan

Total gross74.5% of target

Total gross: $256,409 actual against a target of $344,245, 74.5% of target.

$256,409Target $344,245

Pace$8,271.26 per selling dayKPI-TGT-008

Selling-day pace projection$256,409KPI-TGT-010

Selling-day pace projection is $87,836 below target.

How total gross against plan is measured
  • Target (KPI-TGT-003): the sum of store-scope plan rows for the selected stores and months. Department rows exist in the same governed dataset and are refinements of the store plan, never addends.
  • Attainment (KPI-TGT-004): summed actual divided by summed target, over the same stores on both sides. It is never the average of store percentages, and a store with no plan contributes to neither side.
  • Pace (KPI-TGT-008): actual divided by governed selling days elapsed, counted from the governed date dimension’s selling-day flag and shared by all three stores.
  • Selling-day pace projection (KPI-TGT-010): pace multiplied by the month’s selling days. It is linear arithmetic over the calendar — not a forecast, not a prediction and not a statistical model — and it ignores the within-month shape of trading, so an early-month figure moves more than a late-month one.
KPI_CATALOG.mdsection 39 — KPI-TGT-003, KPI-TGT-004, KPI-TGT-008, KPI-TGT-010View KPI_CATALOG.md (section 39 — KPI-TGT-003, KPI-TGT-004, KPI-TGT-008, KPI-TGT-010) on GitHub (opens in a new tab)

Targets are synthetic internal operating goals for the fictional Granite Auto Group. They are not industry benchmarks, manufacturer objectives or any real dealership’s plan.

Inventory exposure

Active inventory
251

-3 units lower than September 2025

Inventory investment
$5,503,203

-$147,444 lower than September 2025

Aged units
102

+22 units higher than September 2025

Aged percentage
40.6%

+9.1 percentage points higher than September 2025

Age and capital exposure

Units and the money standing in them, over the exported age bands, at the 31 October 2025 snapshot. A position read at one date and never summed across dates.

5 age bands. 0-30: 85 units, 31-60: 64 units, 61-90: 46 units, 91-120: 23 units, Over 120: 33 units. Read at the 31 October 2025 snapshot, at one date and never summed across dates.

Read age bucket as a table
Active inventory units by age bucket at the snapshot date
Days in stockUnitsShare of unitsInvestment
0-3085 units33.9%$1,856,491
31-6064 units25.5%$1,356,603
61-9046 units18.3%$960,417
91-12023 units9.2%$567,195
Over 12033 units13.1%$762,497

Ramp turns at the 60-day aged threshold, an ARPI project default rather than an industry benchmark. A unit past it may sit in any bucket above it.

Median inventory age, and how these figures are calculated

Median inventory age, at the grain it is published

A median is published per store, per condition group, per snapshot date, and it cannot be combined upward: a group median is not the average of store medians. KPI-INV-004 is an order statistic, computed with PERCENTILE_CONT over the units themselves in the reporting layer, at the finest grain at which the value is defined.

Exported median inventory age by store and condition group
StoreConditionMedian age
Granite ChevroletNew35.5 days
Granite ChevroletUsed44.5 days
Granite SubaruNew38.5 days
Granite SubaruUsed50 days
Granite Pre-OwnedUsed56 days
Granite Pre-OwnedNewNot applicable

Active inventory

Governed KPI
KPI-INV-001 Active inventory count
Plain English
How many units the group is carrying; the base of every inventory-health measure and the numerator of days supply.
Inclusions and exclusions
The number of vehicles physically in stock at a store on a given snapshot date.
Formula
SUM(inventory_unit_count)
Numerator
SUM(warehouse.fact_vehicle_inventory_snapshot.inventory_unit_count) for rows whose snapshot_date_key equals the single selected as-of date.
Denominator
n/a - additive measure
Grain
Store x snapshot date. Semi-additive across store, vehicle, model, not across dates; summing over a month yields unit-days, not units.
Date basis
snapshot_date_key to dim_date. A single as-of date, defaulting to the latest snapshot in the model.
Unit
Integer count. Thousands separator.
Null behaviour
No denominator. Returns 0 when no units are in stock. Returns BLANK() if the selected date has no snapshot rows at all, signalling missing data rather than an empty lot.
Source reporting view
reporting.vw_inventory_health, reporting.vw_inventory_snapshots
Known limitations
Semi-additivity is the most common way this measure is misreported; a month-level card showing a summed daily count is wrong by roughly a factor of 30 and looks plausible. Every visual must state its time-aggregation rule.
What this page selected
Sum of exported `active_inventory_units` at the single latest snapshot date in the period. Semi-additive: never summed across dates.

Inventory investment

Governed KPI
KPI-INV-002 Inventory investment
Plain English
How much capital is tied up in stock; converts an aging problem from a count into a dollar figure, making it a management priority.
Inclusions and exclusions
The total money invested in the vehicles in stock on a given date: acquisition cost plus reconditioning spend.
Formula
SUM(acquisition_cost + reconditioning_cost)
Numerator
SUM(warehouse.fact_vehicle_inventory_snapshot.inventory_investment) for rows on the selected as-of date, where inventory_investment = acquisition_cost + reconditioning_cost.
Denominator
n/a - additive measure
Grain
Store x snapshot date. Semi-additive, same rule as KPI-INV-001.
Date basis
snapshot_date_key to dim_date, single as-of date.
Unit
Currency, USD, no decimals; large values may be abbreviated, tooltip shows full figure.
Null behaviour
No denominator. Returns 0 when no units are in stock; BLANK() when the date has no snapshot rows.
Source reporting view
reporting.vw_inventory_health, reporting.vw_inventory_snapshots
Known limitations
This is cost invested, not market value or floor-plan exposure. ARPI models no floor-plan interest, holding cost, or carrying cost, so statements about what aged inventory costs per day are not supportable from this data.
What this page selected
Sum of exported `inventory_investment` at the single latest snapshot date in the period.

Aged units

Governed KPI
KPI-INV-005 Aged inventory count
Plain English
The number of units that have crossed the aging threshold; the actionable list of units requiring a pricing or disposal decision.
Inclusions and exclusions
The count of vehicles in stock on the selected date whose days-in-stock exceeds the selected age threshold.
Formula
SUM(inventory_unit_count) WHERE days_in_stock > age_threshold
Numerator
SUM(warehouse.fact_vehicle_inventory_snapshot.inventory_unit_count) for rows on the selected snapshot date where days_in_stock > @age_threshold.
Denominator
n/a - additive measure
Grain
Store x snapshot date. Semi-additive across dates, exactly like KPI-INV-001.
Date basis
snapshot_date_key to dim_date, single as-of date.
Unit
Integer count.
Null behaviour
No denominator. Returns 0 when no units exceed the threshold, a genuine and good business answer.
Source reporting view
reporting.vw_inventory_health, reporting.vw_inventory_snapshots
Known limitations
The threshold (defaulting to 60 days, a project default, not an industry benchmark) is a convention; different operators use 30, 45, 60, or 90 days. Any finding depending on the threshold must state it in the same sentence.
What this page selected
Sum of exported `aged_inventory_units` at the snapshot date, using the aged threshold the export itself carries in `aged_threshold_days`.

Aged percentage

Governed KPI
KPI-INV-006 Aged inventory percentage
Plain English
Normalizes aged-unit exposure for lot size so stores with different inventory volumes can be compared on one scale; the standard inventory-health indicator on an executive page.
Inclusions and exclusions
The share of the active lot that has been in stock longer than the selected age threshold.
Formula
active inventory units above selected age threshold / total active inventory units
Numerator
SUM(warehouse.fact_vehicle_inventory_snapshot.inventory_unit_count) on the selected snapshot date where days_in_stock > @age_threshold, i.e. KPI-INV-005.
Denominator
SUM(warehouse.fact_vehicle_inventory_snapshot.inventory_unit_count) on the same snapshot date and filter context, with no age filter, i.e. KPI-INV-001.
Grain
Store x snapshot date. Non-additive ratio; recompute at every level.
Date basis
snapshot_date_key to dim_date, single as-of date, identical on both sides.
Unit
Percentage, one decimal place, e.g. 18.4%.
Null behaviour
Zero denominator returns BLANK()/NULL. Numerator 0 with a non-zero denominator correctly returns 0.0%.
Source reporting view
reporting.vw_inventory_health
Known limitations
Can improve for a bad reason: wholesaling aged units removes them from the numerator, so the percentage falls while the group takes a loss. Read alongside KPI-INV-002 and wholesale volume; ARPI has no benchmark for a healthy aged percentage.
What this page selected
Exported `aged_inventory_units` divided by exported `active_inventory_units` at the same snapshot date: KPI-INV-005 over KPI-INV-001 as the catalogue declares them, both additive at a single date.

Open the units behind these figures

Lead funnel

Counted by lead-creation date. Recent periods show the lowest conversion and improve for months afterwards: cohort maturity, not performance.

Lead funnel

Leads 851, Contacted 609 (71.6%), Appointment set 218 (35.8%), Showed 148, Sold 38 (4.5%).

  • Leads851

  • Contacted60971.6% KPI-FUN-002

  • Appointment set21835.8% KPI-FUN-003

  • Showed148

  • Sold384.5% KPI-FUN-006

The share is the stage count over leads received: arithmetic on two exported columns, not a governed KPI. The governed rates are named beside each count.

Read lead funnel as a table
Lead funnel. Leads 851, Contacted 609 (71.6%), Appointment set 218 (35.8%), Showed 148, Sold 38 (4.5%).
StageLeadsShare of leads receivedGoverned rate
Leads851100.0%No governed rate at this stage
Contacted60971.6%71.6% (KPI-FUN-002)
Appointment set21825.6%35.8% (KPI-FUN-003)
Showed14817.4%No governed rate at this stage
Sold384.5%4.5% (KPI-FUN-006)
Median response
Not derivable at this scope

Median response time is an order statistic. The export publishes it at store × lead source × lead-creation date, and an order statistic cannot be combined across groups. A group median is not the average of subgroup medians. 641 exported values are in scope. Filter to one store, one lead source and a single day to read the exported value.

Average response
73.5 minutes
Responded
753
No recorded response
98
Response bands, and how these figures are calculated
Responded leads by response band, for the selected period
Response bandLeads
Under 5 minutes74
5 to 15 minutes168
15 to 60 minutes290
Over 60 minutes221

Bands are exported counts from the response view, not a derived distribution. Leads with no recorded response are excluded from both the median and the mean, which is why their count is published beside them: KPI-FUN-008 is blind to a lead nobody answered. The median is published at store, lead source and lead-creation date, so a group-scoped selection will often decline to resolve it — which is the honest answer rather than an average of medians. Response figures are for the selected period; the comparison against September 2025 is on the sales page that owns the trend.

Median response

Governed KPI
KPI-FUN-008 Median response time
Plain English
The headline responsiveness figure; describes what the typical customer actually experiences, undistorted by the tail.
Inclusions and exclusions
The middle value of first-response times: half of responded leads were answered faster, half slower.
Formula
PERCENTILE_CONT(0.5) WITHIN GROUP (ORDER BY first_response_seconds) / 60
Numerator
n/a - order statistic; the input population is warehouse.fact_lead.first_response_seconds for rows where the value is not NULL and is_duplicate = false.
Denominator
n/a - order statistic
Grain
Store x period. Not additive and not decomposable; must be recomputed from row-level values at every aggregation level.
Date basis
lead_created_date_key to dim_date.
Unit
Minutes, integer.
Null behaviour
Returns BLANK()/NULL when the population is empty. Even-sized populations use linear-interpolated PERCENTILE_CONT, fixed so SQL and DAX agree.
Source reporting view
reporting.vw_lead_response, reporting.vw_leads
Known limitations
Shares the never-responded exclusion with KPI-FUN-007 and is equally blind to ignored leads; must be published with the count of leads without follow-up. ARPI states no target response time, having no benchmark data.
What this page selected
PERCENTILE_CONT(0.5) over first_response_seconds, computed in PostgreSQL and exported at store × lead source × lead-creation date. The catalogue states it "must be recomputed from row-level values at every aggregation level"; the export carries no row-level response times, so the console reads the exported value only where the filter resolves to exactly one row.

Average response

Governed KPI
KPI-FUN-007 Average response time
Plain English
Mean time to first response; retained as the companion to the median and for total-response-seconds reconciliation. Not the headline responsiveness figure.
Inclusions and exclusions
The arithmetic mean number of minutes between a lead arriving and the store's first outbound response.
Formula
SUM(first_response_seconds) / COUNT(leads with a response) / 60
Numerator
SUM(warehouse.fact_lead.first_response_seconds) over rows where first_response_seconds IS NOT NULL and is_duplicate = false, divided by 60 for display in minutes.
Denominator
COUNT(warehouse.fact_lead.lead_key) where first_response_seconds IS NOT NULL and is_duplicate = false, same filter context.
Grain
Store x period. Non-additive ratio.
Date basis
lead_created_date_key to dim_date.
Unit
Minutes, one decimal place; values over 24 hours shown in hours with the unit stated.
Null behaviour
Zero responded leads returns BLANK()/NULL. first_response_seconds = 0 (instant auto-response) is valid and included; only NULL is excluded.
Source reporting view
reporting.vw_lead_response
Known limitations
Two compounding distortions: the distribution is severely right-skewed so one late lead can move a store-month's mean, and excluding never-responded leads makes the worst outcomes invisible. Use the median as the headline.
What this page selected
Exported `response_seconds_total` divided by exported `responded_leads`, both summed first, then converted from seconds to minutes as the catalogue unit requires. The exported reconciliation total publishes the same two sums in seconds.

Responded

This figure is an exported column rather than a governed KPI. Sum of the exported additive column `responded_leads` over the period.

No recorded response

This figure is an exported column rather than a governed KPI. Sum of the exported additive column `unresponded_leads` over the period.

Open this cohort by source and campaign

Gross composition

Front and back gross

Front-end gross $151,720, Back-end gross $104,689.

Front-end gross
$151,720
Back-end gross
$104,689
How to read this

Front and back are published separately and are not ranked against each other. A store can hold total gross steady while front collapses and the finance office compensates, and which of those is preferable depends on the store rather than on the figure. The contribution share is computed on the sales and gross page, which owns it, and the reserve-and-product split is on the F&I page, which owns that.

New and used mix

New units 30, Used units 50.

New units
30
Used units
50
How to read this

The independent pre-owned store contributes no new units, and its scoreboard cell says so in words rather than with a zero. Wholesale disposals and dealer trades are excluded from every retail figure on this page, per KPI-SLS-001: the export publishes all-types totals as separate columns and this console never mixes the two.

What the bridge attributes the change to

Total gross change, December 2025

In December 2025, total gross increased by $32,545 against the month before. The bridge attributes +$52,622 to unit volume, -$18,901 to front PVR, -$1,176 to back PVR.

  • Volume effect+$52,622
  • Front PVR effect-$18,901
  • Back PVR effect-$1,176
  • Total change+$32,545
Read total gross change, december 2025 as a table
Total gross change, December 2025. In December 2025, total gross increased by $32,545 against the month before. The bridge attributes +$52,622 to unit volume, -$18,901 to front PVR, -$1,176 to back PVR.
ComponentRoleAmount
Volume effectAttributed movement+$52,622
Front PVR effectAttributed movement-$18,901
Back PVR effectAttributed movement-$1,176
Total changePeriod total+$32,545
How this decomposition works

The bridge is computed in SQL by reporting.vw_gross_change_bridge and carried through the export. It is a SEQUENTIAL decomposition: each effect is measured with the earlier ones already applied, so the order is part of the method and a different order would apportion the same change differently. The bridge attributes; it does not establish cause.

Effects smaller than $500 are grouped into a single remainder rather than listed — display materiality — project default. Grouped, never dropped: the listed effects and the remainder sum to the period change exactly.

Management attention

Deterministic prompts from rules written down in advance. A reason to look, not a finding, a recommendation or a claim about cause.

View all 47 review prompts

Whether the books agree

A variance between the stock schedule and the general ledger is a finding to investigate, not a broken record, and both sides are valid data.

Comparable positions
7
Reconciled
6
Signed variance
-$865.40
the subledger carries more than the general ledger
One-sided
0
No variance exists, so these are counted and never added to the money.

Stock schedule against the general ledger

At the 31 October 2025 comparison, the last month end inside the selected period. A position at a date, never summed across dates.

7 comparable positions, netting -$865.40: the subledger carries more than the general ledger.

  • New Vehicle Inventory · 1210$0.00
    Reconciled
  • Used Vehicle Inventory · 1220$0.00
    Reconciled
  • Certified Vehicle Inventory · 1230$0.00
    Reconciled
  • New Vehicle Inventory · 1210-$865.40
    Variance
  • Used Vehicle Inventory · 1220$0.00
    Reconciled
  • Certified Vehicle Inventory · 1230$0.00
    Reconciled
  • Used Vehicle Inventory · 1220$0.00
    Reconciled
Read stock schedule against the general ledger as a table
Stock schedule against the general ledger. 7 comparable positions, netting -$865.40: the subledger carries more than the general ledger.
Control accountStateSigned variance
New Vehicle Inventory · 1210Reconciled$0.00
Used Vehicle Inventory · 1220Reconciled$0.00
Certified Vehicle Inventory · 1230Reconciled$0.00
New Vehicle Inventory · 1210Variance-$865.40
Used Vehicle Inventory · 1220Reconciled$0.00
Certified Vehicle Inventory · 1230Reconciled$0.00
Used Vehicle Inventory · 1220Reconciled$0.00

Reconciliation exceptions in this fictional dataset include deliberately planted controlled scenarios used to prove the control surface. They are not discovered errors in a real dealership, and both sides are generated from one governed model rather than reconciled between two independent systems.

4 governed exceptions in scope, each on its own business date. Open accounting integrity, account by account

Detail, on demand

Every governed column, for every store in scope

Three operating models side by side and not ranked. A cell a store cannot have reads Not applicable rather than zero, because a zero in a performance column is read as performance.

  • Granite Chevrolet

    Franchise New and Used · Nashua, NH

    Retail units
    34KPI-SLS-001
    New units
    18KPI-SLS-002
    Front PVR
    $1,861KPI-GRS-004
    Back PVR
    $1,476KPI-GRS-005
    Total PVR
    $3,337KPI-GRS-006
    Lead-to-sale
    4.9%KPI-FUN-006
    Aged inventory
    38.0%KPI-INV-006
    Days supply
    83.6 daysKPI-INV-009
    Inventory turn
    4.49KPI-INV-008
    Average response
    65.9 minutesKPI-FUN-007

    Pace against plan

    Retail units: 34 projected / 39 target87.2% of targetTotal gross: $113,471 projected / $154,530 target73.4% of target
  • Granite Subaru

    Franchise New and Used · Manchester, NH

    Retail units
    30KPI-SLS-001
    New units
    12KPI-SLS-002
    Front PVR
    $1,050KPI-GRS-004
    Back PVR
    $1,261KPI-GRS-005
    Total PVR
    $2,312KPI-GRS-006
    Lead-to-sale
    5.2%KPI-FUN-006
    Aged inventory
    42.6%KPI-INV-006
    Days supply
    97.2 daysKPI-INV-009
    Inventory turn
    3.64KPI-INV-008
    Average response
    79.5 minutesKPI-FUN-007

    Pace against plan

    Retail units: 30 projected / 34 target88.2% of targetTotal gross: $69,354 projected / $94,464 target73.4% of target
  • Granite Pre-Owned

    Independent Used · Merrimack, NH

    Retail units
    16KPI-SLS-001
    New units
    Not applicableKPI-SLS-002
    Front PVR
    $3,559KPI-GRS-004
    Back PVR
    $1,040KPI-GRS-005
    Total PVR
    $4,599KPI-GRS-006
    Lead-to-sale
    2.8%KPI-FUN-006
    Aged inventory
    41.5%KPI-INV-006
    Days supply
    150.0 daysKPI-INV-009
    Inventory turn
    2.90KPI-INV-008
    Average response
    76.3 minutesKPI-FUN-007

    Pace against plan

    Retail units: 16 projected / 23 target69.6% of targetTotal gross: $73,584 projected / $95,250 target77.3% of target
  • New units. Not applicable to the independent store, which holds no franchise.

  • Lead-to-sale. Lead cohort, by creation date.

  • Days supply. Trailing 30 days, a project default.

  • Inventory turn. Annualized, whole months only.

  • Average response. The median (KPI-FUN-008) is an order statistic published only at store, source and day; see the funnel section.

  • Pace against plan. The selling-day pace projectionbeside the month’s target, per store. It is linear arithmetic over the governed selling-day calendar, not a forecast. Targets are synthetic internal operating goals for the fictional Granite Auto Group. They are not industry benchmarks, manufacturer objectives or any real dealership’s plan.

What is not built yet

Every console section the information architecture names is built. Nothing is outstanding, so nothing is listed here — this region reports completion rather than disappearing, because a disclosure that vanished would leave a reader unsure whether the work closed or the claim was withdrawn.

The Management Action Center was the last entry, delivered by `DASH.12`. What remains in the backlog is hardening and release rather than a surface: the delivery increments are recorded in the dashboard backlog, and this console still publishes figures and deterministic rule outputs rather than recommendations.