Technical
How ARPI works
Seeded synthetic data generated in Python, validated in memory, loaded into a PostgreSQL dimensional warehouse, published through reporting views that own every KPI definition, and exported as content-addressed files.
- Reporting views
- 28
- Own the SQL side of every KPI
- Governed KPIs
- 29
- Formula, both sides, grain, caution
- Reconciliations
- 58
- Proved on every run
- SQL scripts
- 178
- Ordered, re-runnable end to end
Deterministic synthetic data.Granite Auto Group is fictional.Real-engine validation pending.How this is governed
What it is
A governed analytical layer, not a dealer management system
ARPI publishes one consistent operating view over what dealership systems produce. It is the system of record for nothing.
- Seeded generatorsPython, deterministic from a profile
- ValidationIn memory, before anything is written
- CSV + digestContent-addressed, byte-reproducible
- PostgreSQLRaw, staging, warehouse
- Reporting viewsOwn the SQL side of every KPI
- Semantic modelTMDL, reads reporting onlyEngine validation pending
- Governed exportWhat this console reads
One model, seven domains
Seven domains share conformed store, date, vehicle and employee keys, so a figure means the same thing whichever surface reads it.
Every metric has both sides
A ratio is published with its numerator, denominator, grain, date basis and the caution a reader needs before quoting it.
Reconciled, not asserted
Each run proves its totals against independently computed ones. A rule never observed failing is not treated as a control.
The business being modelled
One group, three businesses
Three rooftops in Southern New Hampshire, reported through one governed layer. Two carry a manufacturer allocation; the third buys every unit it lists. Those differences are why a group total needs a store dimension under it.
Granite Chevrolet of Nashua
The franchise volume store
Granite Chevrolet of Nashua is the group's volume franchise rooftop. Its inventory is dominated by new Chevrolet trucks and utilities arriving on manufacturer allocation, with a small pre-owned presence beside them.
- Listings
- 199
- New
- 195
- Pre-owned
- 4
- Makes
- 5
- Median advertised
- $49,304
98% of this snapshot is new inventory, across 5 makes and model years 2015 to 2027.
Allocation is not acquisition
The most useful thing a group report can know about these three stores is which of them chooses what it stocks. Two do not.
Why these stores cannot share one operating model
Franchise: Granite Chevrolet and Granite Subaru
A franchise rooftop sells a manufacturer's new vehicles under a sales and service agreement, and what arrives is largely decided by allocation: the store orders into a build schedule it does not control. Its levers are pricing, merchandising and turn.
In this snapshot the two franchise stores hold 203 of the group's new listings and all of them. A group report that compares new-vehicle days supply across all three stores is comparing two stores and an empty set.
Independent: Granite Pre-Owned
It shows in the data. The independent store carries 30 makes against the Chevrolet store's 5, and the widest model-year spread in the group. Neither is a performance result. Both are structural facts a report has to respect.
The same eight columns, for all three
Every cell is computed from that store's own workbook. Where the source exposed no value, the cell says so. Snapshot 2 August 2026.
| Store | Type | Listings | New | Pre-owned | Makes | Model years | Median advertised price |
|---|---|---|---|---|---|---|---|
| Granite Chevrolet of NashuaNashua, NH | Franchise dealershipChevrolet | 199 | 195 | 4 | 5 | 2015 to 2027 | $49,304 |
| Granite Subaru of ManchesterManchester, NH | Franchise dealershipSubaru | 24 | 8 | 16 | 4 | 2020 to 2026 | $28,946 |
| Granite Pre-Owned Center of MerrimackMerrimack, NH | Independent pre-owned dealership | 318 | 0 | 318 | 30 | 2001 to 2025 | $17,395 |
Group price range across the 252 priced listings: $7,395 to $109,674.
Derived at build time from 3 sanitized workbooks committed to this repository: 541 listings across 3 stores. Snapshot date 2 August 2026.
- data/.../2026-08-02/ARPI_Granite_Chevrolet_Inventory_Sanitized_2026-08-02.xlsxsanitized inventory snapshotView data/reference/inventory/gsa-001/2026-08-02/ARPI_Granite_Chevrolet_Inventory_Sanitized_2026-08-02.xlsx (sanitized inventory snapshot) on GitHub (opens in a new tab)
- data/.../2026-08-02/ARPI_Granite_Subaru_Inventory_Sanitized_2026-08-02.xlsxsanitized inventory snapshotView data/reference/inventory/gsa-002/2026-08-02/ARPI_Granite_Subaru_Inventory_Sanitized_2026-08-02.xlsx (sanitized inventory snapshot) on GitHub (opens in a new tab)
- data/.../2026-08-02/ARPI_Granite_Pre_Owned_Center_Inventory_Sanitized_2026-08-02.xlsxsanitized inventory snapshotView data/reference/inventory/gsa-003/2026-08-02/ARPI_Granite_Pre_Owned_Center_Inventory_Sanitized_2026-08-02.xlsx (sanitized inventory snapshot) on GitHub (opens in a new tab)
Inventory by dealership
Listing counts, not units on the ground.
Read inventory by dealership as a table
| Category | Listings |
|---|---|
| Granite Chevrolet | 199 |
| Granite Subaru | 24 |
| Granite Pre-Owned | 318 |
New and pre-owned mix
Normalised to the share of each store's own snapshot, because the three differ in size by more than an order of magnitude.
- New
- Pre-owned
Read new and pre-owned mix as a table
| Store | New | Pre-owned | Total |
|---|---|---|---|
| Granite Chevrolet | 195 | 4 | 199 |
| Granite Subaru | 8 | 16 | 24 |
| Granite Pre-Owned | 0 | 318 | 318 |
One number per question, and a store dimension under it
- One definition, conformed across stores
- Store context travels with the number
- A group total that can be taken apart
What each of those three actually guarantees
- One definition, conformed across stores
A retail unit means the same thing at all three rooftops, so a group total is a sum rather than a negotiation.
- Store context travels with the number
Store type and franchise brand are attributes of the dimension, so a comparison that would be meaningless across an independent and a franchise store is blocked at the model rather than caught in review.
- A group total that can be taken apart
Every group figure on this site decomposes to the three store figures that produce it, and the generator refuses to write an artefact whose store totals do not reconcile.
The product tour
Five things you can open right now
Each frame is a straight capture of the route named on it, taken from a production build. Nothing here is a mockup.
/Captured from the running application. Default filter state
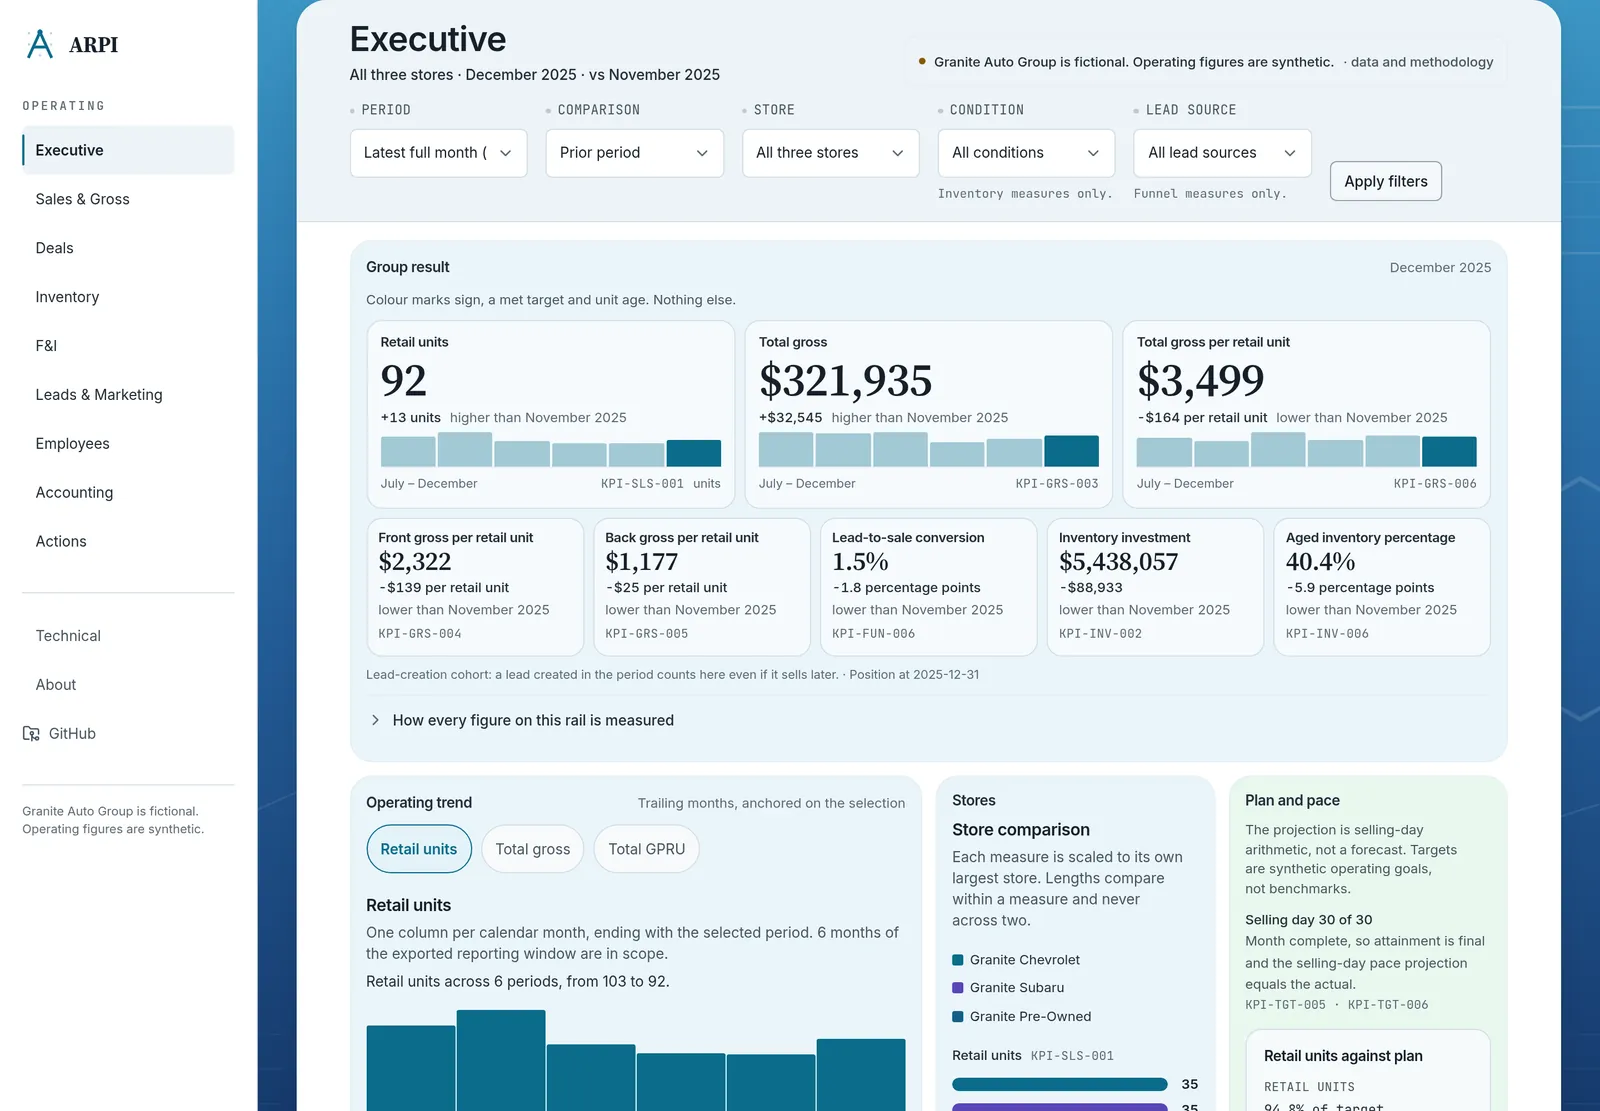
Start on the operating console
The group at a glance: retail units, gross, gross per retail unit, lead-to-sale conversion, inventory investment and aged inventory, each against the prior month, above the operating trend, a store comparison and where the month sits against plan. Every figure carries the identifier of the governed KPI that defines it, and drills through to the transactions behind it.
Why the console renders with scripting switched off
The whole surface is rendered on the server from an export packaged at build time, and there is exactly one client island on it — the filter form. The trend’s metric switch is a radio group and CSS, so it ships no JavaScript and cannot recalculate anything. With scripting switched off the rail, the trend, the comparison, the pace bullets and every disclosure are all still there, and filter state stays in the URL, so any view of the console is a link somebody else can open.
Every count below is generated from repository evidence on each build, and the build fails if one has drifted.
- 28Reporting viewspowerbi/validation/sql_baseline_metadata.jsonreporting_view_countView powerbi/validation/sql_baseline_metadata.json (reporting_view_count) on GitHub (opens in a new tab)
- 29Governed KPIsKPI_CATALOG.mdKPI indexView KPI_CATALOG.md (KPI index) on GitHub (opens in a new tab)
- 42Semantic relationshipspowerbi/.../definition/relationships.tmdlrelationship definitionsView powerbi/ARPI_Performance_Intelligence/ARPI_Performance_Intelligence.SemanticModel/definition/relationships.tmdl (relationship definitions) on GitHub (opens in a new tab)
- 49DAX measurespowerbi/.../definition/tablesmeasure definitions in TMDLView powerbi/ARPI_Performance_Intelligence/ARPI_Performance_Intelligence.SemanticModel/definition/tables/ (measure definitions in TMDL) on GitHub (opens in a new tab)